Questo documento è un estratto del Rapporto sul cambiamento climatico in linea con le raccomandazioni della Task Force on Climate-related Financial Disclosures (TCFD[1]) elaborato dalla società ISS ESG per Etica Sgr in relazione al posizionamento dei fondi della Linea Valori Responsabili.
Tutti i titoli sono stati analizzati secondo le raccomandazioni della TCFD, così suddivisi: Portafoglio azionario; Portafoglio delle obbligazioni societarie e Portafoglio delle obbligazioni governative.
In questo documento sono riportati i risultati ottenuti alla fine dell’anno 2019 e, di seguito, sono riportati i parametri di valutazione delle emissioni di carbonio utilizzati nell’analisi dei tre Portafogli dei fondi della Linea Valori Responsabili (per ulteriori informazioni consultare l’Appendice):
- Relative Carbon Footprint: una misura normalizzata, definita come somma delle emissioni totali di carbonio del Portafoglio per milione di euro investiti. Qualsiasi riferimento ai parametri della Relative Carbon Footprint nell’analisi è inteso in base alla formula tCO2e/milione di euro investiti;
- Weighted Average Carbon Intensity (WACI) è il parametro espressamente consigliato dalla TCFD per gli asset manager. La WACI assegna le emissioni di gas serra Scope 1 e 2 in base alle ponderazioni del Portafoglio ed ha tra i suoi aspetti positivi il fatto che è semplice da calcolare e facile da comunicare agli investitori e, soprattutto, può essere applicata a tutte le asset class in quanto non si basa sull’approccio della titolarità. Qualsiasi riferimento alla Carbon Intensity nell’analisi è inteso come tCO2e/milione di euro di ricavi.
Le metriche utilizzate per l’analisi dei dati, oltre a comprendere la valutazione dell’impronta di carbonio sulla base delle misure tradizionali di Relative Carbon Footprint, Carbon Intensity e Weighted Average Carbon Intensity – WACI, hanno visto l’integrazione di indicatori che permettono di valutare rischi e opportunità legati al cambiamento climatico in una prospettiva di medio-lungo periodo.
Tali parametri sono[2]: il carbon risk rating di ISS-ESG, l’analisi di scenario climatico per il mantenimento del riscaldamento climatico entro una certa soglia, il rischio di transizione climatica verso un’economia a basso impatto di carbonio e, la valutazione dell’esposizione al rischio climatico fisico.
-
La valutazione del carbon risk rating
La valutazione del carbon risk rating (CRR) stabilisce in che modo un emittente è esposto a rischi legati al cambiamento climatico e, come gestisce le opportunità di adeguamento in modo da evitare o limitare i rischi.
Il CRR[4] può fornire indicazioni critiche sul grado di preparazione degli emittenti sulla transizione ad un’economia a basso impatto di carbonio. Esso può essere applicato nell’analisi previsionale per la definizione di rischi e opportunità legati alla transizione low-carbon per l’intero Portafoglio.
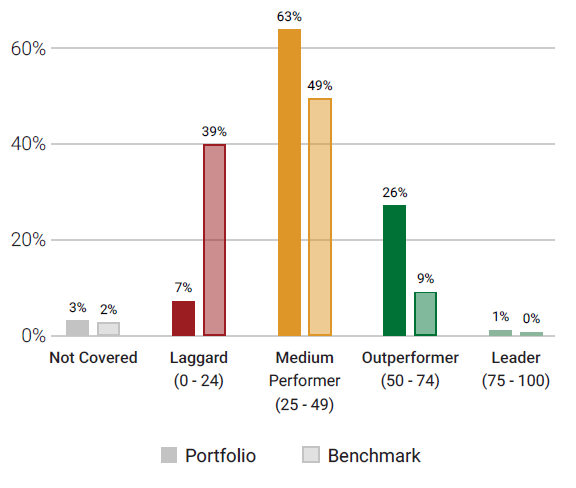
La media ponderata del CRR del Portafoglio azionario della Linea Valori Responsabili è pari a 43, un dato migliore rispetto al benchmark (36).
In Figura 3 è indicata la distribuzione del CRR del Portafoglio azionario della Linea Valori Responsabili rispetto al benchmark.
![]()
Figura 3: Distribuzione del CRR del Portafoglio azionario della Linea Valori Responsabili rispetto al benchmark
-
Analisi di scenario climatico
L’analisi di scenario segue un approccio quantitativo; essa parte dall’analisi dell’intensità di carbonio associata alle emissioni dirette di ciascun emittente, per valutare a quale scenario climatico è allineato il Portafoglio nel suo complesso, data la market share associata a ciascun emittente e il suo carbon budget.
Per l’analisi di scenario ISS ESG utilizza i tre scenari climatici previsti dall’Agenzia internazionale per l’energia (IEA) e la metodologia di valutazione della riduzione delle emissioni: “Sectoral Decarbonization Approach” (SDA) sviluppata dalla Science Based Targets initiative (SBTi), che delinea una traiettoria per l’andamento di riduzione delle emissioni per ciascun settore di appartenenza.
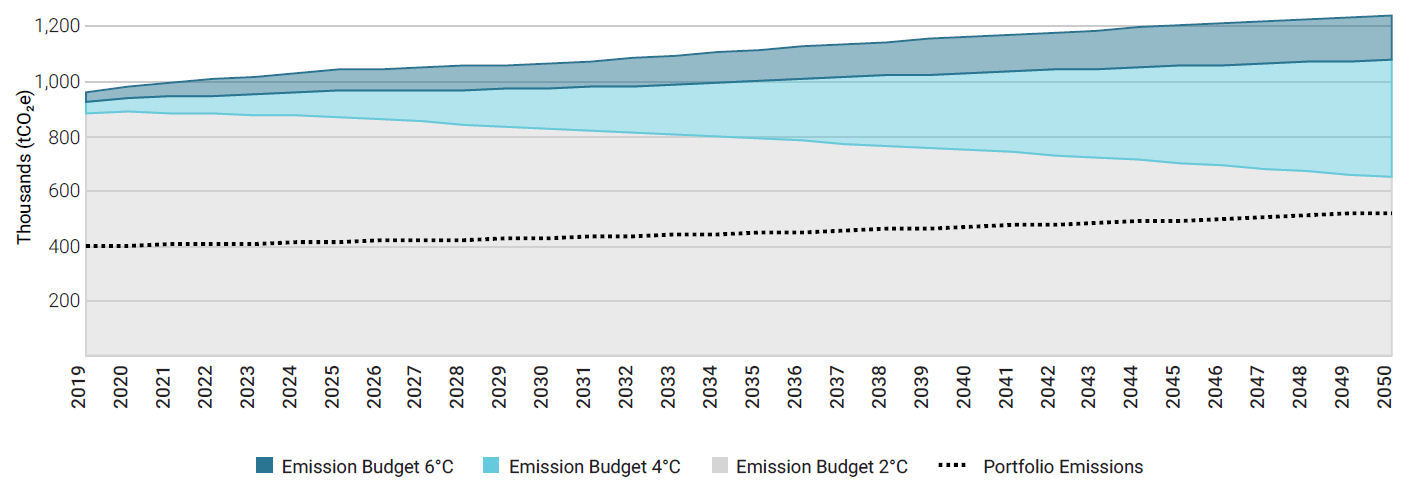
Il Portafoglio azionario dei fondi della Linea Valori Responsabili è allineato con uno scenario 2°C per l’intero periodo preso in esame. La linea tratteggiata rappresenta l’andamento previsto delle emissioni di gas serra del Portafoglio[5].
Inoltre, dato lo scenario dei 2°C, si prevede che i livelli di emissioni di gas serra diminuiscano in maniera significativa a partire dalla fine del 2025. Diversamente dall’allineamento del Portafoglio con uno scenario allineato ai 2°C per l’intero periodo analizzato, il benchmark non è allineato con tale scenario e supera il carbon budget nel 2028.
![]()
Figura 4: Andamento delle emissioni di gas serra del Portafoglio azionario della Linea Valori Responsabili rispetto agli scenari climatici
-
Rischio di transizione climatica
Per una futura economia a minor impatto di carbonio, è fondamentale passare a un mix di produzione energetica che sostituisca ai combustibili fossili le fonti di energia di tipo rinnovabile.
Per quanto riguarda i rischi di transizione climatica[6], il Portafoglio azionario dei fondi della Linea Valori Responsabili evidenzia una performance migliore rispetto a quella del benchmark. L’esposizione del Portafoglio alla generazione di energia da fonti rinnovabili (55,5%) è molto maggiore rispetto a quella del benchmark, ed è già in linea con un mix energetico compatibile con uno scenario di mantenimento del riscaldamento climatico entro i 2°C per il 2030.
-
Esposizione al rischio fisico legato al clima
L’aumento dei livelli della temperatura del pianeta, anche nell’ipotesi di mantenimento entro i 2°C, comporterà cambiamenti climatici con conseguenti rischi fisici. I rischi fisici derivanti dal cambiamento climatico possono essere classificati in rischi cronici come siccità, stress termico e aumento del livello del mare, e rischi acuti quali eventi climatici estremi e inondazioni. L’esposizione delle imprese a questi due tipologie di rischio fisico dipende da due fattori principali: il settore di appartenenza e la regione geografica in cui sono presenti attività produttive[7].
![]()
-
Valutazione del carbon risk rating
La valutazione del carbon risk rating (CRR) stabilisce in che modo un emittente è esposto a rischi legati al cambiamento climatico e, come gestisce le opportunità di adeguamento in modo da evitare o limitare i rischi.
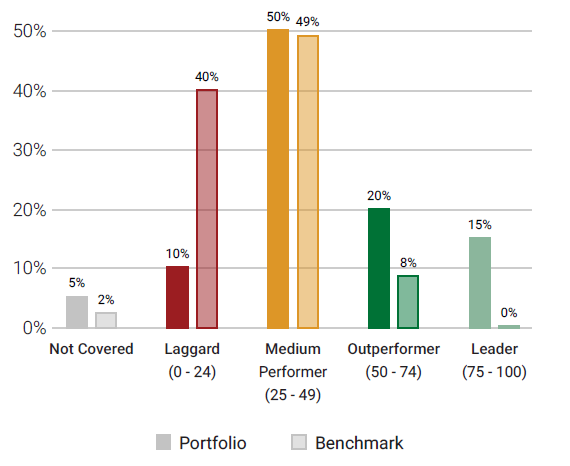
Il CRR[9] può fornire indicazioni sul grado di preparazione degli emittenti sulla transizione ad un’economia a basso impatto di carbonio. Esso può essere applicato nell’analisi previsionale per la definizione di rischi e opportunità legati alla transizione low-carbon per l’intero Portafoglio. La media ponderata del CRR del Portafoglio delle obbligazioni societarie della Linea Valori Responsabili è pari a 53, un dato migliore rispetto al benchmark (36).
In Figura 8 è indicata la distribuzione della CRR del Portafoglio rispetto al benchmark.
![]()
Figura 8: Distribuzione del CRR del Portafoglio delle obbligazioni societarie della Linea Valori Responsabili rispetto al benchmark
-
Analisi di scenario climatico
L’analisi di scenario segue un approccio quantitativo; essa parte dall’analisi dell’intensità di carbonio associata alle emissioni dirette di ciascun emittente, per valutare a quale scenario climatico è allineato il Portafoglio nel suo complesso, data la market share associata a ciascun emittente e il suo carbon budget.
Per l’analisi di scenario ISS ESG utilizza i tre scenari climatici previsti dall’Agenzia internazionale per l’energia (IEA) e la metodologia di valutazione della riduzione delle emissioni: “Sectoral Decarbonization Approach” (SDA) sviluppata dalla Science Based Targets initiative (SBTi), che delinea una traiettoria per l’andamento di riduzione delle emissioni per ciascun settore di appartenenza.
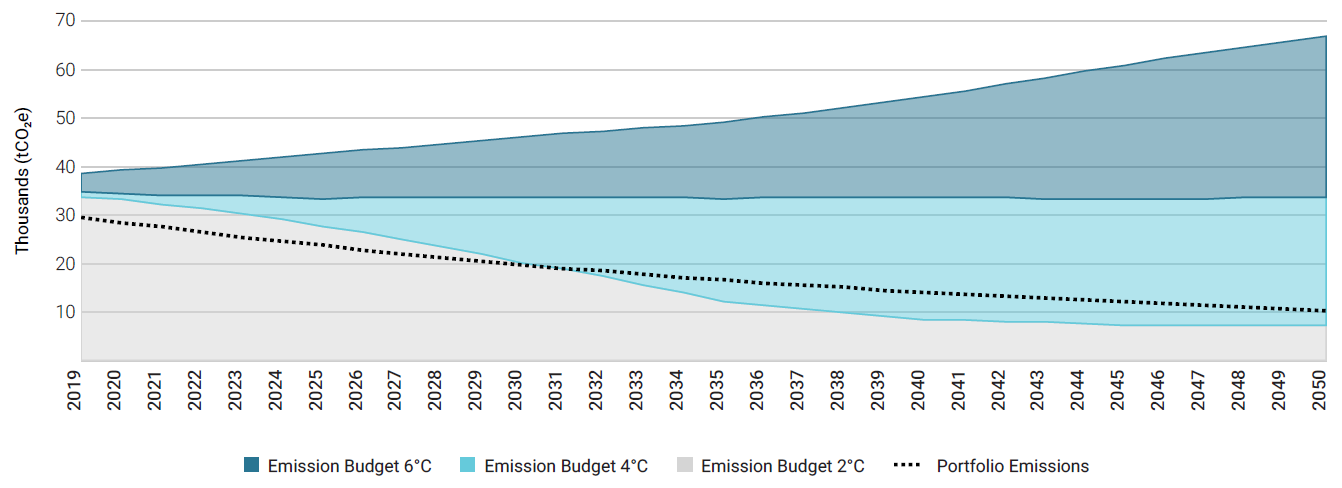
Il Portafoglio delle obbligazioni societarie dei fondi della Linea Valori Responsabili è allineato con uno scenario di mantenimento del riscaldamento climatico entro i 2°C fino al 2031. La linea tratteggiata rappresenta l’andamento previsto delle emissioni di gas serra del Portafoglio[10]. Nello scenario di mantenimento del riscaldamento climatico entro i2°C, si prevede che i livelli di emissioni di gas serra diminuiscano in maniera significativa fino al 2035 e poi più lentamente fino al 2050. Il benchmark non è allineato con tale scenario e supera il carbon budget nel 2028.
![]()
Figura 9: Andamento delle emissioni di gas serra del Portafoglio delle obbligazioni societarie della Linea Valori Responsabili, rispetto agli scenari climatici.
-
Rischio di transizione climatica
Per una futura economia a minor impatto di carbonio, è fondamentale passare a un mix di produzione energetica che sostituisca ai combustibili fossili le fonti di energia di tipo rinnovabile.
Per quanto riguarda i rischi di transizione climatica[11], il Portafoglio delle obbligazioni societarie dei fondi della Linea Valori Responsabili evidenzia una performance migliore rispetto a quella del benchmark. L’esposizione del Portafoglio alla generazione di energia da fonti rinnovabili (67%) è molto maggiore rispetto al benchmark, ed è già in linea con un mix energetico compatibile con uno scenario di mantenimento del riscaldamento climatico entro i 2°C fino al 2050.
-
Esposizione al rischio fisico legato al clima
L’aumento dei livelli della temperatura del pianeta, anche nell’ipotesi di mantenimento entro i 2°C, comporterà cambiamenti climatici con conseguenti rischi fisici. I rischi fisici derivanti dal cambiamento climatico possono essere classificati in rischi cronici come siccità, stress termico e aumento del livello del mare, e rischi acuti quali eventi climatici estremi e inondazioni. L’esposizione delle imprese a questi due tipologie di rischio fisico dipende da due fattori principali: il settore di appartenenza e la regione geografica in cui sono presenti attività produttive[12].
![]()
Figura 10: Esposizione ai rischi fisici legati al clima del Portafoglio delle obbligazioni societarie della Linea Valori Responsabili (verde: rischio basso; arancio: rischio medio; rosso: rischio elevato)
[1] Launched after the 2015 Paris Agreement by the Financial Stability Board (FSB), the Task Force on Climate-related Financial Disclosure (TCFD – https://www.fsb-tcfd.org/) considers climate transparency as a crucial factor for the stability of financial markets. The objective of the TCFD is therefore to improve climate transparency in financial markets through recommendations on disclosure. These recommendations provide a “consistent framework that improves the ease of both producing and using climate-related financial disclosures”. The TCFD aims to create a unique standard for both corporate and investment disclosure, understanding that local regulatory frameworks may require different compliance levels.
[2] The metrics mentioned in the list refer to equity and corporate bonds portfolios. For sovereign bonds portfolios the risk-related metrics are limited to physical risk exposure of countries.
[3] The benchmark used in the Data Analysis is ISHARES MSCI ACWI ETF as a proxy of the MSCI World Net Total Return (in Euro).
[4] CRR is based on a scale of 0 (very poor performance) to 100 (excellent performance) and allows to categorise companies according to their carbon-related performance into four groups: Climate Laggards, Climate Underperformers, Climate Performers, and Climate Leaders. For more details, please refer to Appendix.
[5] The GHG emission pathway and carbon budget of the Portfolio are the result of the aggregation of company-level data. The GHG emission trajectories at the company-level include both historical (i) and forward-looking indicators (ii) to project the emission intensity profile of a company from now until year 2050:
- The scenario analysis utilises 5 years of the ISS ESG historical, high-quality emission intensity data to create a trend for each company included in the analysis.
- The historical trend is then combined with forward looking emission reduction commitments and targets to estimate future emissions.
For a specific company to be in line with either the 2°C, 4°C and 6°C climate scenario, the allocated carbon budget per year need to be higher than the estimated direct emissions for the same company. The emissions and carbon budget at the company-level are then aggregated to get a Portfolio 2°C, 4°C and 6°C scenario alignment.
[6] Further details on the methodology are reported in the Appendix.
[7] Further details on the methodology are reported in the Appendix.
[8] The benchmark used in the Data Analysis is ISHARES MSCI ACWI ETF as a proxy of the MSCI World Net Total Return (in Euro).
[9] CRR is based on a scale of 0 (very poor performance) to 100 (excellent performance) and allows to categorise companies according to their carbon-related performance into four groups: Climate Laggards, Climate Underperformers, Climate Performers, and Climate Leaders. For more details, please refer to Appendix.
[10] The GHG emission pathway and carbon budget of the Portfolio are the result of the aggregation of company-level data. The GHG emission trajectories at the company-level include both historical (i) and forward-looking indicators (ii) to project the emission intensity profile of a company from now until year 2050 :
- The scenario analysis utilises 5 years of the ISS ESG historical, high-quality emission intensity data to create a trend for each company included in the analysis.The historical trend is then combined with forward looking emission reduction commitments and targets to estimate future emissions.
- For a specific company to be in line with either the 2°C, 4°C and 6°C climate scenario, the allocated carbon budget per year need to be higher than the estimated direct emissions for the same company. The emissions and carbon budget at the company-level are then aggregated to get a Portfolio 2°C, 4°C and 6°C scenario alignment.
[11] Further details on the methodology are reported in the Appendix.
[12] Further details on the methodology are reported in the Appendix.
[13] For the Sovereign bonds portfolios two benchmarks are used: AMUNDI INDEX JPM EMU GOVIES ETF as a proxy of the benchmark JP Morgan EMU and the index Invesco Euro Government Bonds 1 – 3 Year UCITS ETF EUR Inav as a proxy of the benchmark ICE BofAML Euro Treasury Bill Index.
[14] In the Sovereign Bonds section of this report, Figure 11 displays the “Sovereign Emissions Exposure” of the Portfolio taking Scope 1 & 2 emissions into account. The “Relative Carbon Footprint” is a normalised measure, defined as the total carbon emissions of the Portfolio per million EUR invested. “The Weighted Average Carbon Intensity” differs from the one calculated for non-sovereign portfolios because the GDP of the country is used instead of the revenue of the company.
[15] Adjusted Enterprise Value is calculated as Total Market Cap + Total Debt. For non-listed entities where MCap is not available, total debt only is used.
[16] For sovereign bonds the revenue is replaced by the GDP of the country.
[17] The PCAF is a coalition of twelve Dutch financial institutions launched via the Dutch Carbon Pledge at the COP-21 Summit in Paris and is led by ASN Bank. The objective of this coalition is to develop a standard that enables financial institutions to set targets for carbon emissions and measure the extent to which these targets are achieved, which was presented in a December 2017 report (http://carbonaccountingfinancials.com/).
[18] Data availability limits the implementation of the exact methodology in practice. Data scarcity consists of (i) lack of data based on the same sector classifications for emissions and for expenditure, resulting in inaccuracies when matching the two data sets; and (ii) lack of sector-based expenditure data for many countries, particularly developing countries.


