
This document is a commented summary of the Climate Impact Report released by the company ISS ESG [1] based on its proprietary methodology, concerning the holdings of Etica Funds’ multilabel SICAV (also referred to as “the portfolio”). The report includes metrics aligned with the guidelines of the Task Force on Climate-related Financial Disclosures (TCFD[2].).
All asset classes have been analysed according to the TCFD recommendations, grouped as follows: Equity Portfolio and Corporate Bonds Portfolio together and, Sovereign Bonds Portfolio.
The analysis outlines the climate performance calculated on the portfolio at the year-end of 2023. It is divided into the following sections: carbon metrics, scenario analysis, transitional climate risks analysis, physical risks, additional insights, and conclusions.
- Carbon metrics
- Comparison with SICAV portfolio year-end 2022
- Scenario Analysis
- Transitional climate risks analysis
- Physical risks
- Conclusions
- Sovereign bonds
Carbon metrics
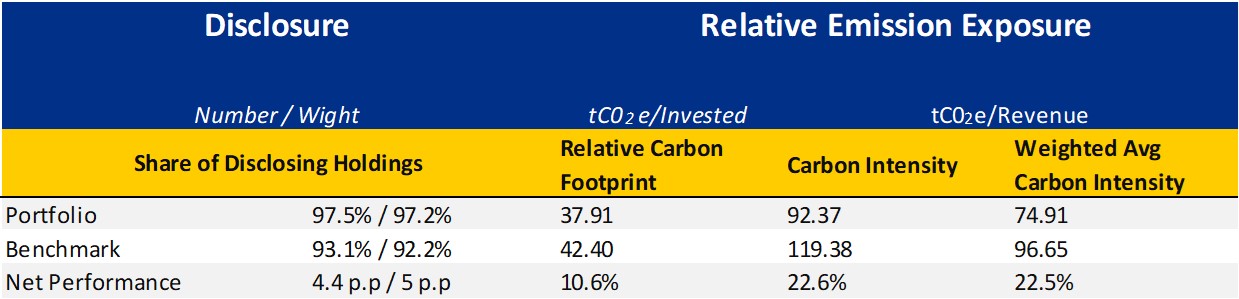
The carbon metrics used in the Equity and Corporate Bonds analysis are the following ones and are explicitly recommended by the TCFD:
- Relative Carbon Footprint: defined as the total scope 1 and scope 2 GHG emissions of the portfolio, directly attributable to the investor through its ownership share in companies’ total market value (also defined as “Emissions Exposure”), per million EUR invested. It is measured in tCO2e/EUR million invested.
- Carbon intensity: defined as the total scope 1 and 2 GHG emission intensity of the portfolio (based on issuers’ revenues), directly attributable to the investor through its ownership share in the companies’ total market value. It is measured in tCO2e/EUR million revenue.
- The Weighted Average Carbon Intensity (WACI): expresses scope 1 and 2 GHG emission intensity (based on issuers’ revenues), proportional to the issuers’ weight in the portfolio. Hence, this does not take the ownership share into account. It is measured in tCO2e/EUR million revenue.
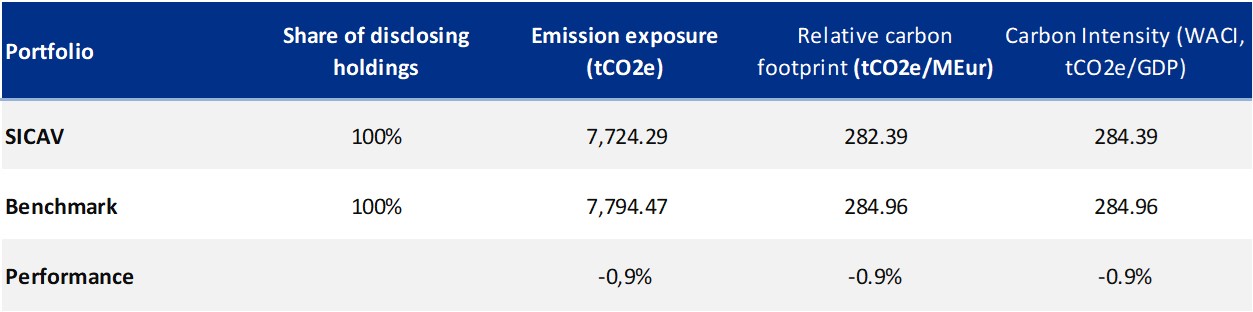
Overall, the relative carbon footprint of the portfolio amounts to 37,91 tCO2e/EUR million. The carbon intensity is 9237 tCO2e/EUR million. The weighted average carbon intensity is 74,91 tCO2e/EUR million.
All metrics substantially decreased from 2021 to 2023, with carbon intensity falling by 60%.
In 2021 and 2022 Etica Funds endeavored to reduce the climate impact of funds by the systematic inclusion of a specific climate impact valuation model in its selection methodology. As of June 2023, the climate assessment has been fully applied.
Portfolio Overview
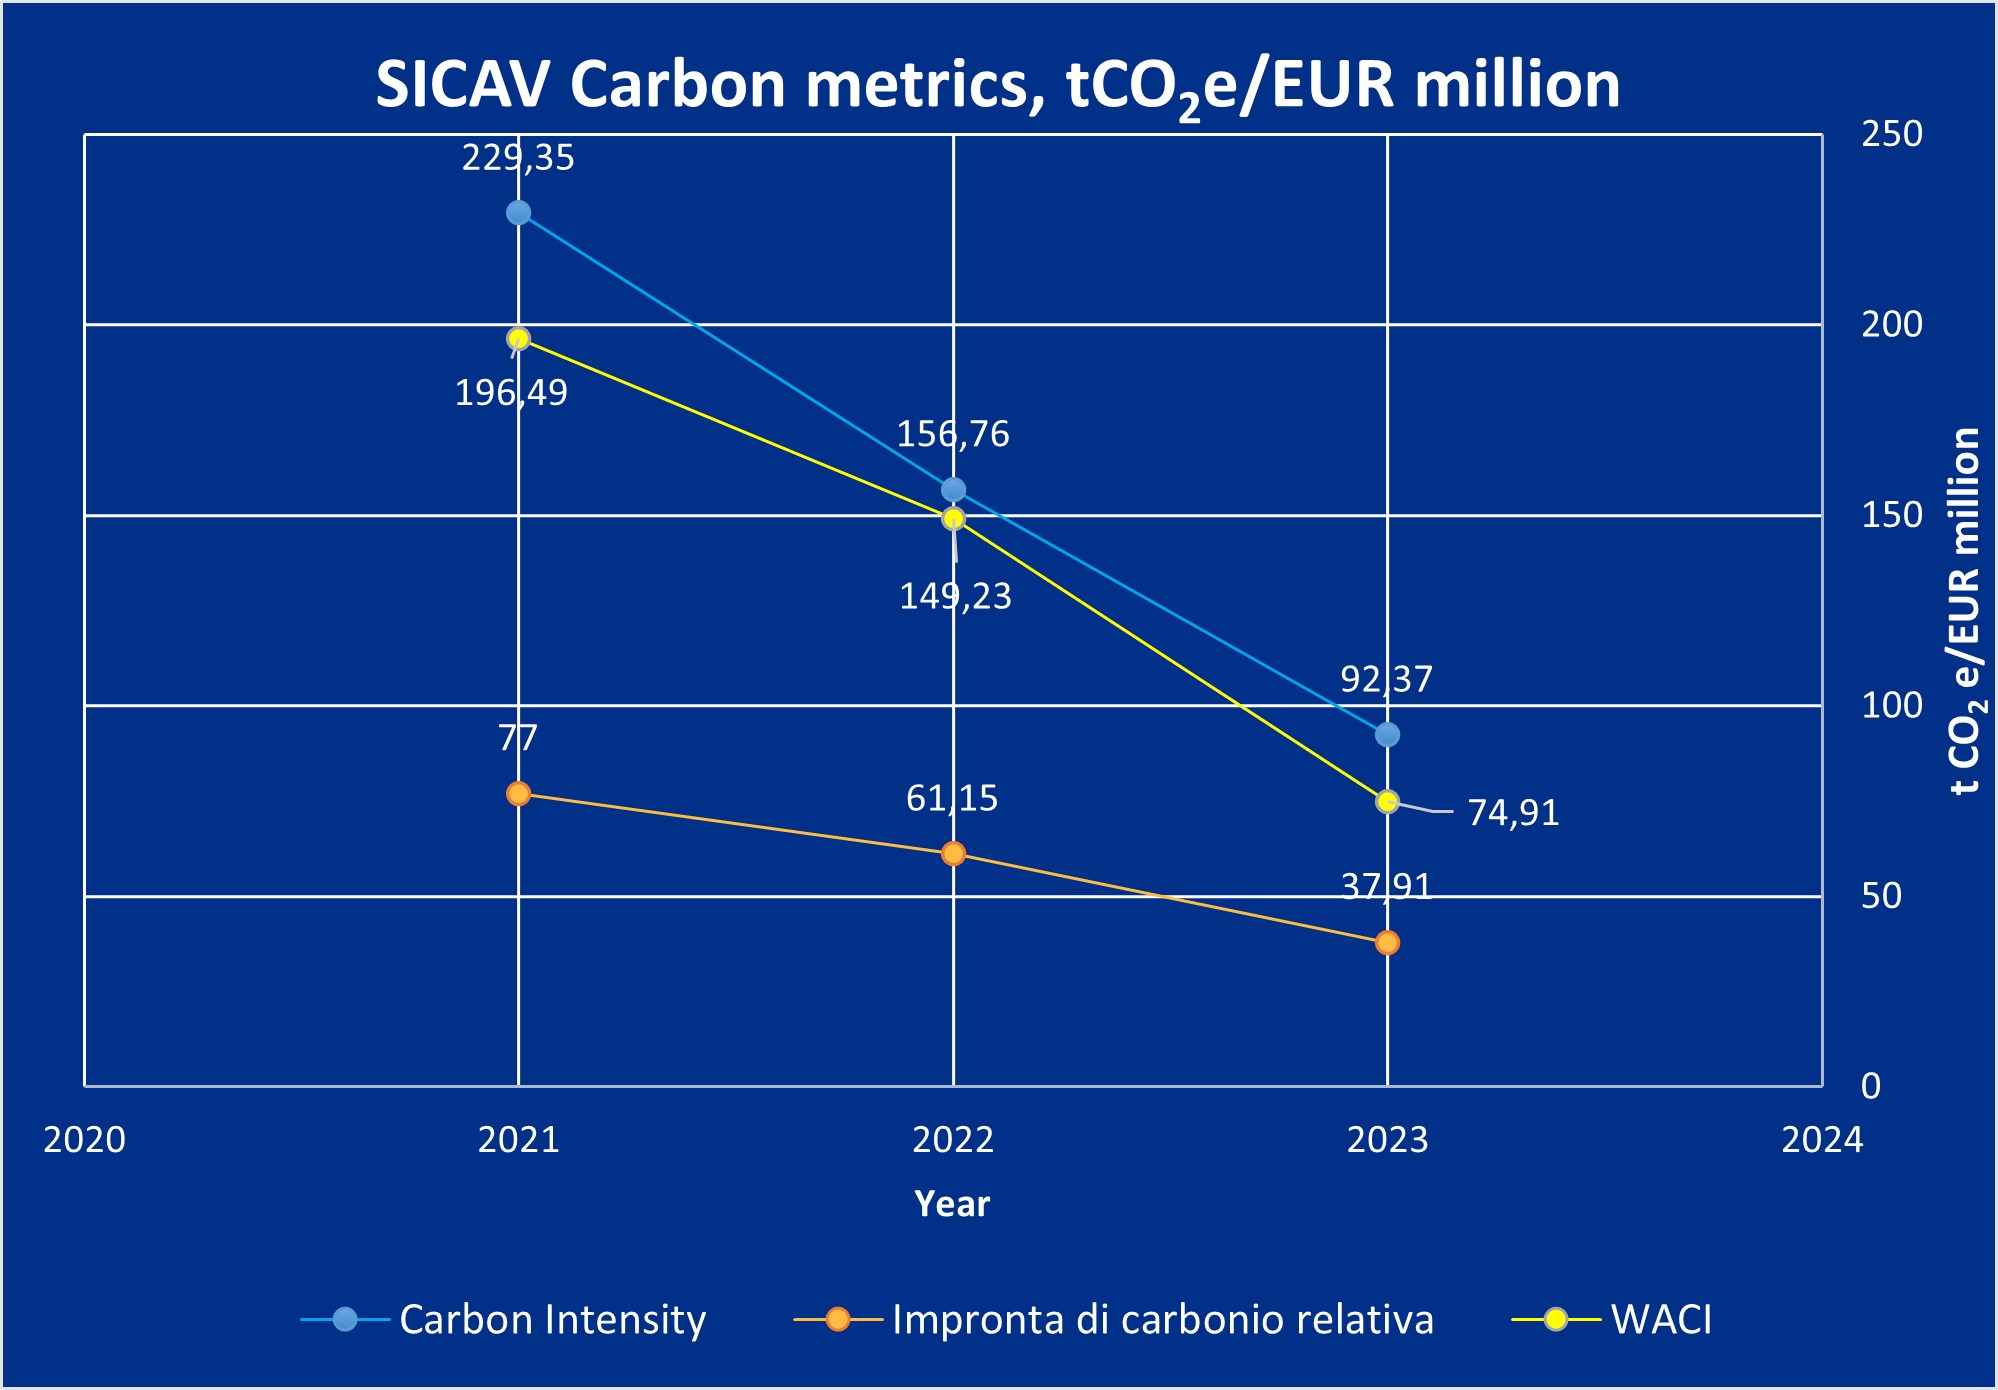
Comparison with SICAV portfolio year-end 2022
Since the first calculation at year-end 2021all the Carbon Metrics dropped from 50% to 61,9% .
| Relative carbon footprint | Carbon Intensity | WACI | ||
| Portfolio year end 2023 | 37,91 | 92,37 | 74,91 | |
| Portfolio year end 2022 | 61,15 | 156,76 | 149,23 | |
| Portfolio year end 2021 | 77 | 229,3 | 196,5 | |
| Delta 2021-2023 | -50,8% | -59,7% | -61,9% |
Scenario Analysis
The purpose of the scenario analysis is to examine the current and future emission intensity from the direct and indirect emissions of a company (GHG scope 1&2) to see which climate scenario it is aligned with, until 2050. Each company’s carbon budget is defined based on its current and estimated future market share.
The scenario analysis compares the current and future portfolio’s GHG emissions with the carbon budget estimated in different IEA scenarios: Sustainable Development Scenario (SDS)[3], Announced Pledges Scenario (APS) and Stated Policies Scenario (STEPS)[4]. Each scenario is tied to a carbon budget, i.e. a limited amount of fossil carbon that can be combusted worldwide to remain within a certain temperature. The carbon budget changes depending on the scenario, with the Sustainable Development Scenario being the most ambitious one, consistent with a global temperature increase well below 2°C by 2010, compared to pre-industrial levels.
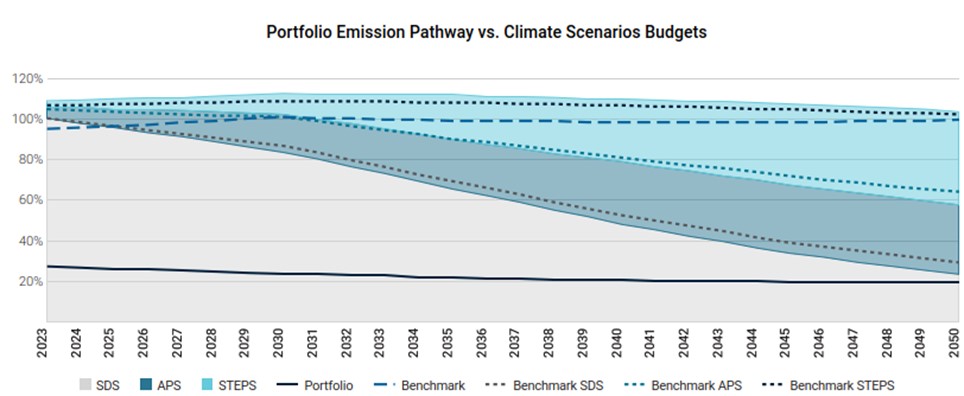
Performance is shown as the percentage of the assigned budget used by the portfolio and benchmark. The analysis shows that the portfolio remains below the carbon budget associated to the Stated Policies Scenario (STEPS) and the Announced Pledges Scenario (APS) until 2050.
Performance is shown as a percentage of the allocated budget used by the portfolio and the benchmark. The analysis shows that the current state of the portfolio is consistent with a 2050 SDS scenario.
This means that, for the first time, the SICAV have a potential temperature increase of 1.5°C.
In the analysis performed in 2022, Etica’s portfolio was associated to a temperature increase of 1.7°C by 2050, and an overshoot of the carbon budget associated to the SDS scenario in 2043.
This result shows a significant improvement in the funds’ carbon footprint.
To make a comparison, the graph above also shows the scenario analysis for the index MSCI World ESG Universal Net Total Return (referred to as “Benchmark”) as a proxy for the equity market. The index exceeds the budget of the SDS scenario already in 2026 and is associated with a temperature increase of 2.7°C by 2050.
The better performance of the portfolio compared to the benchmark is explained by two factors, linked to the sectorial allocation and the single stock selection:
- The exclusion of most fossil activities from the portfolio;
- Higher number of companies with a commitment to reducing emissions.
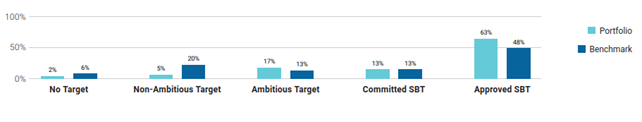
Notably, 63% of the portfolio’s value is covered by a GHG reduction target approved by the Science-Based Targets initiative (SBTi), against 48% of the benchmark.
Compared to last year’s analysis of the portfolio at the end of 2022, there’s a 4.5% increase in the number of companies committed to international climate targets and a 14.5% increase in the number of companies covered by an SBTi approved target.
Transitional climate risks analysis
The transitional climate risks analysis dives into the power generation mix of the portfolio.
Of the overall power generation installed capacity by companies in the portfolio, 72,5% comes comes from renewables. An improvement on the 64% of the 2023 TCFD. In the benchmark index, the share of renewable energy capacity is around 25,8%.
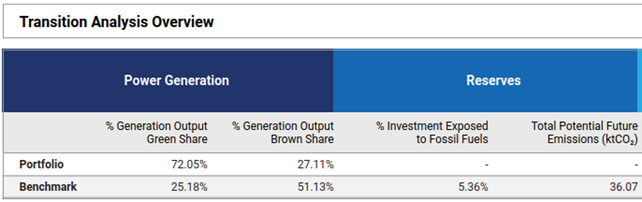
The current energy generation mix of the portfolio exhibits a higher share of renewables than in the Sustainable Development Scenario of the International Energy Agency in 2030, which envisages 84% of renewables in 2050 and 53% in 2030.
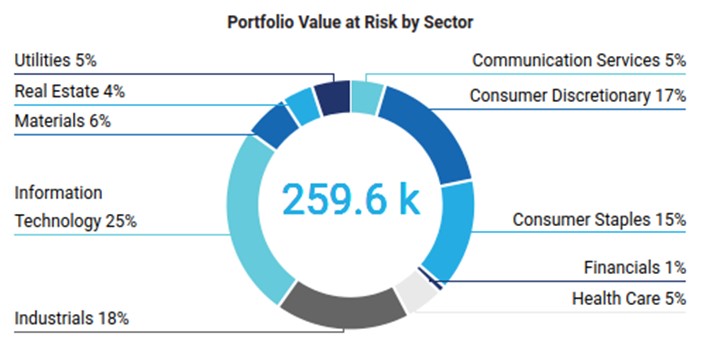
Physical risks
ISS employs a model to estimate the potential value losses, estimated by 2050, arising from the change in share price due to climate physical risks, computing the Value at Risk (VaR) of each issuer. The valuation model considers the following risks: changes in capital value via changes in Property, Plant and Equipment (PP&E), repair costs to damaged assets via investments in Capital Expenditure (CAPEX), increases in production costs via changes in Selling, General and Administrative Expenses, (SG&A) or Cost of Goods Sold (COGS), change in income via sales.
The analysis is based on the most relevant scenarios used as part of the IPCC 5th Assessment Report (AR5). The baseline scenario is built around Representative Concentration Pathway (RCP) 4.5 (1.7-3.2 ℃ temperature rise by 2100). In this scenario, the portfolio value at risk by 2050 is estimated to be 259.600 EUR, with Industrials, Information technology and Consumer Discretionary being the most exposed ones. This represents a 0,56% loss in the overall portfolio value. The value at risk rises to 413.000 EUR if a worst-case scenario is employed, assuming a temperature increase over 3.2°C.
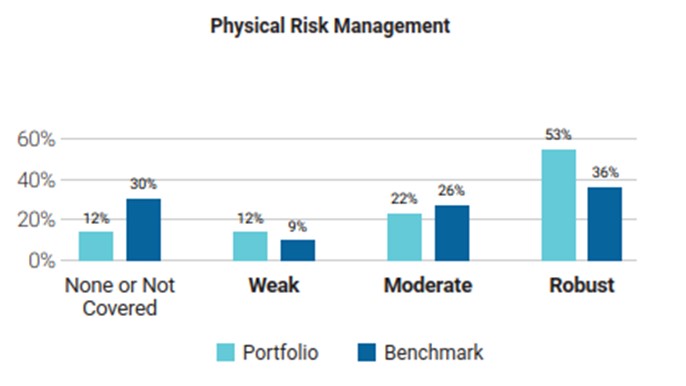
However, based on the ISS assessment, only the 12% of issuers have a weak physical risk management strategy and the 53% have a robust strategy.
Conclusions
The main takeaway from the analysis performed in 2021 was to introduce a specific assessment of companies to reduce the carbon footprint of investment. During 2022 a specific climate assessment has been included in the methodology to better monitor GHG emissions in companies operating in Materials, Industrial and Utilities sectors and in any business related to fossils. The effects of such changes are fully applied to the portfolios in June 2023.
The portfolio’s carbon intensity at the end of 2023 is lower than in previous years and there is evidence of a steady decrease in the carbon intensity since 2021. Indeed, carbon intensity at the end of June 2023 is 50,6% lower than at the end of 2021, thanks to methodological interventions that occurred and to the positive performance of companies previously selected for investments.
The scenario analysis shows that the portfolio is now, and for the first time, aligned with a projected temperature increase of 1.5°C.
Sovereign bonds
This Sovereign analysis compares the carbon emissions and other carbon related characteristics of the underlying portfolio with the benchmark. The tables below include absolute and relative figures for portfolio carbon emissions as well as intensity measures for both production and government emissions. The latest available reporting year is 2021 for Annex 1 Countries (UNFCCC) and 2020 for non-Annex 1 Countries (CAIT).
- “Emission Exposure” section measures the carbon footprint of a sovereign portfolio. Scope 1 Emissions are in tCO₂e while Scope 2 and Scope 3 Emissions are only in CO2;
- Relative carbon footprint is defined as the total carbon emissions of the portfolio per million invested;
- Carbon intensity is expressed as the weighted average carbon emissions per million of PPP adj GDP as a proxy of the carbon efficiency per unit of output.
To account for the different calculation possibilities as well as to offer various perspectives, ISS ESG provides data for the following two different sovereign emission categories:
- Production Emissions: Emission footprint of a country’s production with its imports according to the latest PCAF guidelines released in December 2022.
- Government Emissions: This approach takes into account that a government bond co-finances both direct emissions from the public sector and investments made by the government.
Production emissions
Governament Emissions
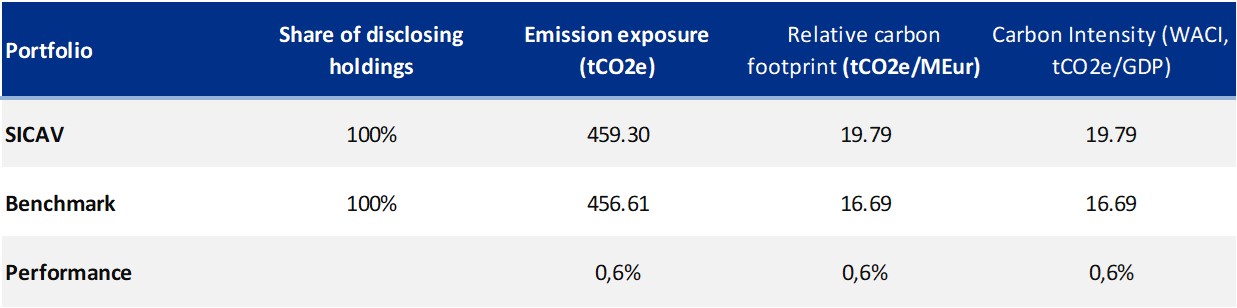
In general, the performance is in line with the benchmark and the gap between the portfolio and the benchmark is smaller than last year. This is due to the new portfolio composition at the end of 2023, which has more or less the same weighting as the benchmark. In 2022, there was indeed a significant overexposure to Italy.
References
[1] https://www.issgovernance.com/esg/
[2] Launched after the 2015 Paris Agreement by the Financial Stability Board (FSB), the Task Force on Climate-related Financial Disclosure (TCFD – https://www.fsb-tcfd.org/) considers climate transparency as a crucial factor for the stability of financial markets. The objective of the TCFD is therefore to improve climate transparency in financial markets through recommendations on disclosure. These recommendations provide a “consistent framework that improves the ease of both producing and using climate-related financial disclosures”. The TCFD aims to create a unique standard for both corporate and investment disclosure, understanding that local regulatory frameworks may require different compliance levels. By October 12, 2023, the TCFD had fulfilled its mission and disbanded, although it remains a valid guideline for assessing and reporting on climate-related risks.
[3] The Sustainable Development Scenario is not more developed in the World Energy Outlook 2022 by the International Energy Agency. However, to guarantee comparability with previous years, this edition of the report still relies on it.
[4] Details on the scenarios and on underlying assumptions are available at World Energy Model – Analysis – IEA
This is a marketing communication.
This communication has been written by Etica SGR S.p.A., as investment manager and global distributor of the funds Etica ESG Global Equity, Etica ESG Dynamic Allocation, Etica ESG Conservative Allocation (the “Funds”) of the SICAV under Luxembourg law called Multilabel Sicav, established by Carne Global Fund Managers (Luxembourg) S.A. (Carne LUX) and is intended for professional investors only.
Investment in the Funds entails the acquisition of shares in the SICAV and involves risks associated with possible changes in the share values, which are in turn affected by fluctuations in the value of the financial instruments in which the assets of the Funds are invested.Investors should conclude an investment transaction involving the Funds only after having fully understood their overall characteristics and degree of exposure to related risks, by carefully reading the prospectus and the key investor information document (KID), which, together with information on sustainability pursuant to Regulation (EU) 2019/2088, can be found at www.eticasgr.com.
Investing in the Funds offers no guarantee of return and does not ensure repayment of initially invested capital. Any future returns are subject to taxation, which is based on the personal situation of each investor and may change in the future. The investment goals, situation and financial needs of potential recipients have not been taken into account in the drafting of this communication. It can therefore in no way be interpreted as investment advice.
The recipients of this communication assume full and absolute responsibility for the use of the information it contains, as well as for any investment decisions made on the basis thereof, since any use of the information as support for investment decisions is not permitted and is at the investor’s own risk.The Funds are authorised to be marketed in Italy exclusively to professional investors. The issuer may, however, decide to stop marketing them in Italy. The Funds are not authorised to be marketed in certain jurisdictions. Therefore, marketing activities may not be conducted in relation to them in those jurisdictions. This communication may not be distributed to parties other than its intended recipients, nor reproduced in all or in part, in any form whatsoever, without the prior authorisation of Etica SGR S.p.A.


 VALORI RESPONSABILI 2024")
