
This document is a commented summary of the Climate Impact Report released by the company ISS ESG [1] based on its proprietary methodology, concerning the holdings of Etica’s Fund Linea Valori Responsabili (also referred to as “the portfolio”). The report includes metrics aligned with the guidelines of the Task Force on Climate-related Financial Disclosures (TCF)[2].
All asset classes have been analysed according to the TCFD recommendations, grouped as follows: Equity Portfolio and Corporate Bonds Portfolio together and, Sovereign Bonds Portfolio.
The analysis outlines the climate performance calculated on the portfolio at the year-end of 2023 and compares it with the index MSCI World ESG Universal Net Total Return as a market benchmark (also referred to as “the benchmark”) on the same date.
- Carbon metrics
- Comparison with Valori Responsabili portfolio year-end 2022
- Scenario Analysis
- Transitional climate risks analysis
- Physical risks
- Conclusions
- Sovereign bonds
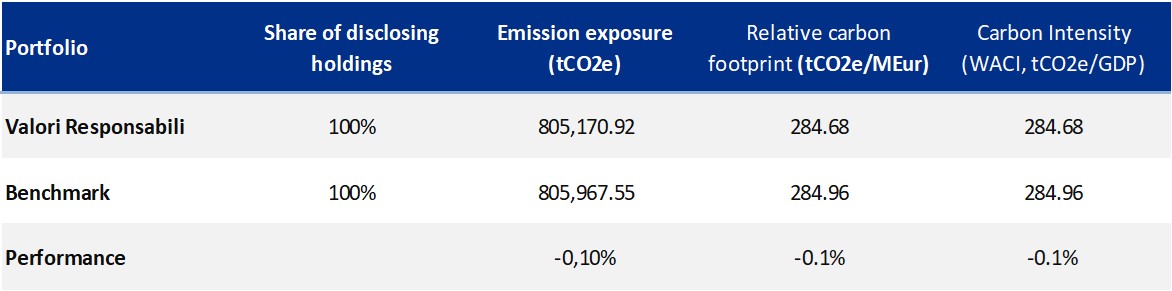
Carbon metrics
The carbon metrics used in the Equity and Corporate Bonds analysis are the following ones and are explicitly recommended by the TCFD:
- Relative Carbon Footprint: defined as the total scope 1 and scope 2 GHG emissions of the portfolio, directly attributable to the investor through its ownership share in companies’ total market value (also defined as “Emissions Exposure”), per million EUR invested. It is measured in tCO2e/EUR million invested.
- Carbon intensity: defined as the total scope 1 and 2 GHG emission intensity of the portfolio (based on issuers’ revenues), directly attributable to the investor through its ownership share in the companies’ total market value. It is measured in tCO2e/EUR million revenue.
- The Weighted Average Carbon Intensity (WACI): expresses scope 1 and 2 GHG emission intensity (based on issuers’ revenues), proportional to the issuers’ weight in the portfolio. Hence, this does not take the ownership share into account. It is measured in tCO2e/EUR million revenue.
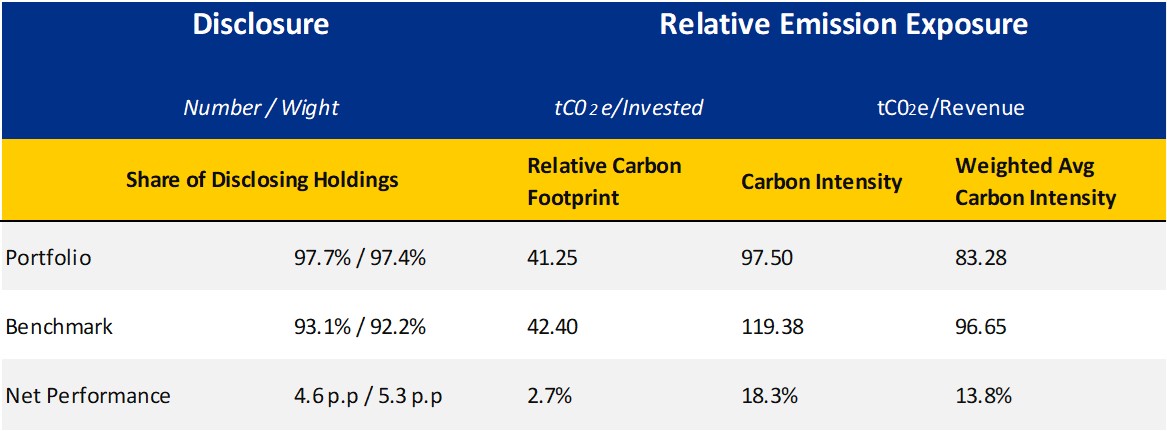
Overall, the relative carbon footprint of the portfolio amounts to 41,25 tCO2e/EUR million, which appears to be 2,7% lower than in the benchmark. The carbon intensity is 97,50 tCO2e/EUR million, 18.3% lower than the benchmark. The weighted average carbon intensity is 83,28%, 13,8% lower than the benchmark. Note that 97,7% of entities included in the portfolio disclose their scope 1 and scope 2 GHG emissions, compared to 93,1% in the benchmark.
This is a positive result for Etica Funds, also due to the fact that last year’s climate performance didn’t beat the benchmark.
Comparison with Valori Responsabili portfolio year-end 2022
In December 2021, Etica adopted a stricter selection policy for companies involved in fossil fuels activities, including natural gas. In September 2022, the selection policy was further developed to include a specific climate impact assessment of companies involved in any fossil-related activities and those operating in Utilities, Materials and Industrial sectors with high emission intensity. The assessment is slightly different between Valori Responsabili and Etica Impatto Clima, as a higher standard is set for Etica Impatto Clima. As of end 2023, the climate assessment has been fully applied to Valori Responsabili. The change in carbon metrics over time for the portfolio is shown below. Specifically, from 2022 to 2023, the carbon intensity of Valori Responsabili decreased by 40,28%.
| Year of reference | Relative carbon footprint tCO2e/EUR million invested | Carbon intensity
tCO2e/EUR million revenues |
WACI
tCO2e/EUR million revenues |
Carbon intensity Year on Year change (%) |
| 2019 | 265,69 | 310,69 | 302,53 | |
| 2020 | 152,26 | 260,09 | 290,66 | -16,29% |
| 2021 | 79,68 | 228,85 | 207,27 | -12,01% |
| 2022 | 65,81 | 163,27 | 160,26 | -28,66% |
| 2023 | 41,25 | 97,5 | 83,8 | -40,28% |
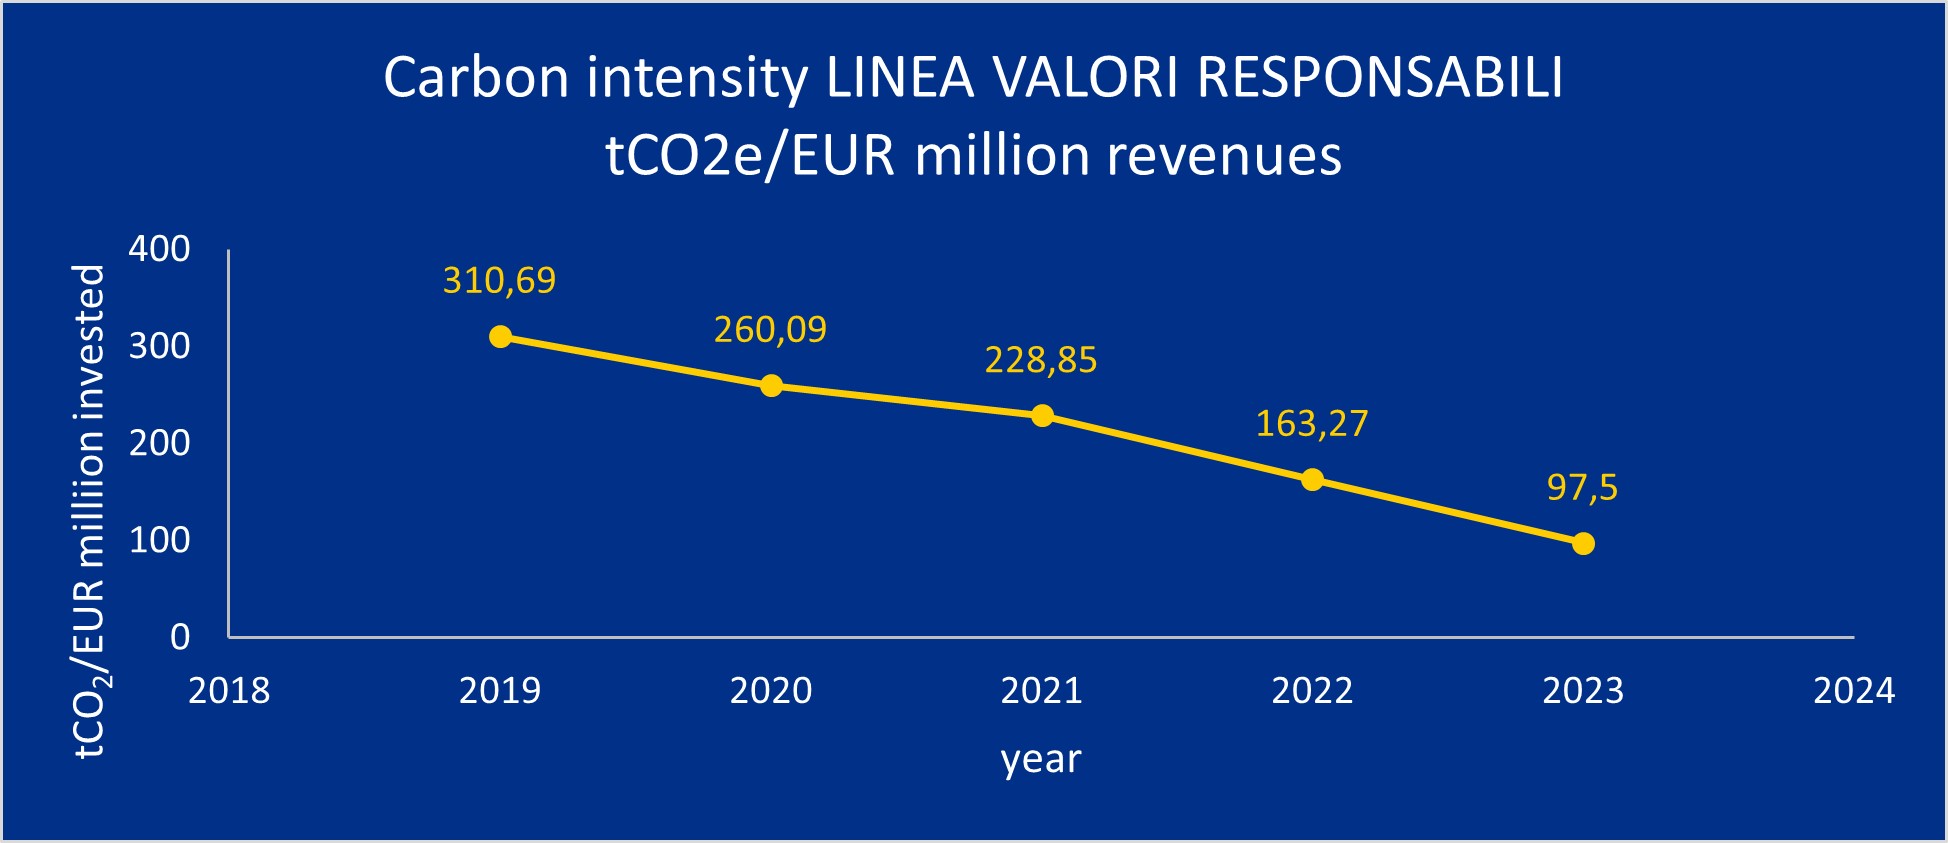
The observed decrease in carbon metrics is driven by both changes in portfolio composition (especially as a consequence of specific interventions in the selection methodology) and a reduction in the emission intensity of companies.
It is possible to compare the portfolio at the end of 2023 with that at the end of 2022, using the latest available data in 2023 for both portfolios to isolate the specific effect of selection changes that affected the portfolio’s composition.
The portfolio’s carbon intensity at the end of 2022 was 163.27 tCO2e/MEUR and that of the same portfolio with the latest available data at the end of 2023 is 129.37 tCO2e/MEUR., therefore it can be computed that:
| Carbon intensity change 2022-2023 | 40,28% |
| Difference in carbon intensity port 2022 – port 2022 (based on 2023 data) | 26,20% |
| Portfolio turnover effect on 2023-2022 change | 14,08% |
| This means that, normalising everything to 100, the 40,28% change in carbon intensity is due to: | |
| Change in portfolio composition resulting from the Etica methodology | 34,94% |
| Changes in issuers’ emission data | 65,05% |
Scenario Analysis
The purpose of the scenario analysis is to examine the current and future emission intensity from the direct and indirect emissions of a company (GHG scope 1&2) to see which climate scenario it is aligned with, until 2050. Each company’s carbon budget is defined based on its current and estimated future market share.
The scenario analysis compares the current and future portfolio’s GHG emissions with the carbon budget estimated in different IEA scenarios: Sustainable Development Scenario (SDS)[3], Announced Pledges Scenario (APS) and Stated Policies Scenario (STEPS)[4]. Each scenario is tied to a carbon budget, i.e. a limited amount of fossil carbon that can be combusted worldwide to remain within a certain temperature. The carbon budget changes depending on the scenario, with the Sustainable Development Scenario being the most ambitious one, consistent with a global temperature increase well below 2°C by 2100, compared to pre-industrial levels.
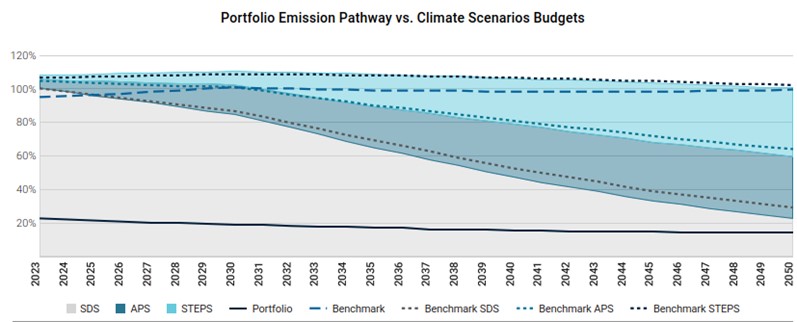
The analysis shows that the current state of the portfolio is consistent with a 2050 SDS scenario.
This means that, for the first time, the Linea Valori Responsabili funds have a potential temperature increase of 1.5°C.
In the analysis carried out in 2022, Etica’s portfolio was associated with a temperature increase of 1.7°C by 2050 and a breach of the carbon budget associated with the SDS scenario in 2043. This result shows a significant improvement in the carbon footprint of the funds.
Conversely, the benchmark exceeds the budget of the SDS scenario in 2026 and is associated with a temperature increase of 2.7°C by 2050.
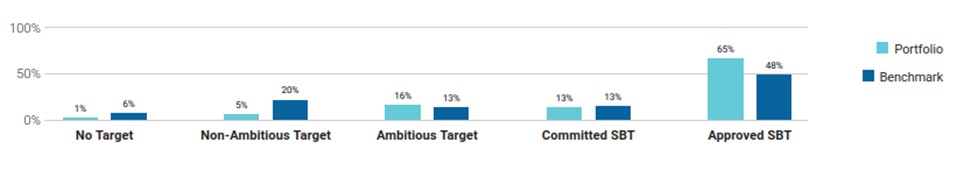
The better performance of the portfolio compared to the benchmark is explained by two factors:
- The exclusion of most fossil activities from the portfolio
- A higher number of companies with a commitment to reduce emissions.
Notably, 65% of the portfolio’s value (58% in the TCFD Report 2022) is covered by a GHG reduction target approved by the Science-Based Targets initiative (SBTi), against 48% of the benchmark.
Transitional climate risks analysis
The transitional climate risks analysis dives into the power generation mix of the portfolio.
Of the overall power generation installed capacity by companies in the portfolio, over 74,96% comes from renewables, against almost 23,86% from thermal power. This is in line with last year’s figure of 69%. In addition, the portfolio also outperformed the benchmark, with the share of renewable energy capacity at around 25% and the share of thermal capacity at almost 51%. Nuclear capacity is 26% in the benchmark and 0% in Linea Valori Responsabili[5]. There is no exposure to fossil fuel reserves.
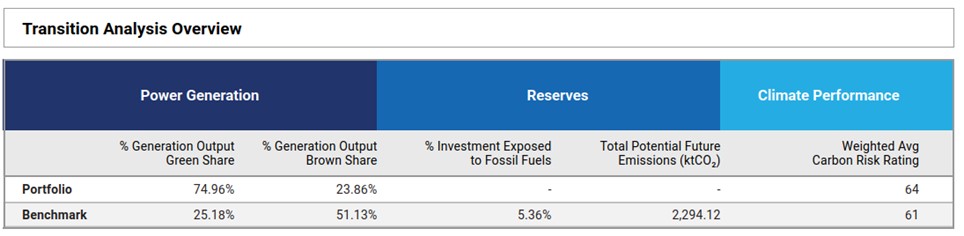
The current energy generation mix of the portfolio exhibits a higher share of renewables than in the Sustainable Development Scenario of the International Energy Agency in 2030, which envisages 84% of renewables in 2050 and 53% in 2030.
Physical risks
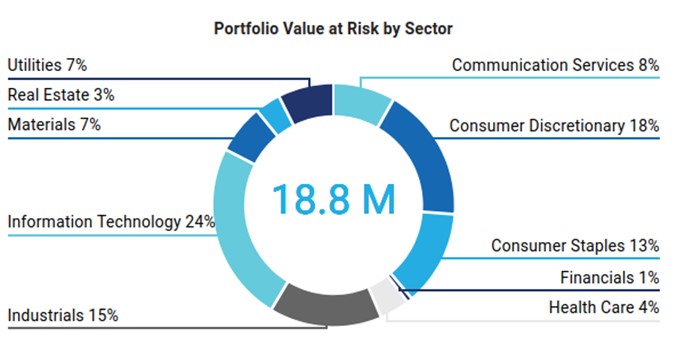
ISS employs a model to estimate the potential value losses, estimated by 2050, arising from the change in share price due to climate physical risks, computing the Value at Risk (VaR) of each issuer. The valuation model considers the following risks: changes in capital value via changes in Property, Plant and Equipment (PP&E), repair costs to damaged assets via investments in Capital Expenditure (CAPEX), increases in production costs via changes in Selling, General and Administrative Expenses, (SG&A) or Cost of Goods Sold (COGS), change in income via sales.
The analysis is based on the most relevant scenarios used as part of the IPCC 5th Assessment Report (AR5). The baseline scenario is built around Representative Concentration Pathway (RCP) 4.5 (1.7-3.2 ℃ temperature rise by 2100). In this scenario, the portfolio value at risk by 2050 is estimated to be 18.8 EUR million (decreased from 22.3 EUR million in 2023), with the Information technology and Industrials being the most exposed ones. This represents a 0,69% loss in the overall portfolio value. The value at risk rises to over 21 EUR million if a worst-case scenario is employed, assuming a temperature increase over 3.2°C.
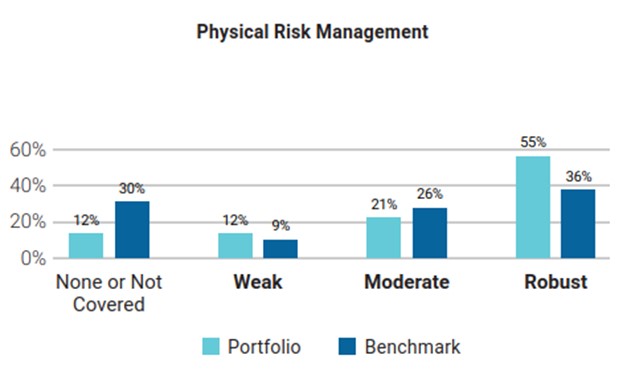
However, only the 12% of issuers have a weak physical risk management strategy and the 57% have a robust strategy.
Conclusions
The main takeaway from the analysis performed in 2021 was to introduce a specific assessment for companies in the Materials sector, the one that contributes the most to the overall portfolio’s carbon intensity. During 2022 a specific climate assessment has been included in the methodology to better monitor GHG emissions in companies operating in Materials, Industrial and Utilities sectors. The effects of such changes are fully applied to the portfolios on 2023.
The portfolio’s carbon intensity at the end of 2023 is lower than in previous years and there is evidence of a steady decrease in the carbon intensity of Valori Responsabili since 2019. Indeed, carbon intensity at the end of 2023 is 69% lower than in 2019, thanks to methodological interventions that occurred and to the positive performance of companies previously selected for investments.
The scenario analysis shows that the portfolio is now, and for the first time, aligned with a projected temperature increase of 1.5°C.
Sovereign bonds
This Sovereign analysis compares the carbon emissions and other carbon related characteristics of the underlying portfolio with the benchmark. The tables below include absolute and relative figures for portfolio carbon emissions as well as intensity measures for both production and government emissions. The latest available reporting year is 2021 for Annex 1 Countries (UNFCCC) and 2020 for non-Annex 1 Countries (CAIT).
- “Emission Exposure” section measures the carbon footprint of a sovereign portfolio. Scope 1 Emissions are in tCO₂e while Scope 2 and Scope 3 Emissions are only in CO2
- Relative carbon footprint is defined as the total carbon emissions of the portfolio per million invested.
- Carbon intensity is expressed as the weighted average carbon emissions per million of PPP adj GDP as a proxy of the carbon efficiency per unit of output.
To account for the different calculation possibilities as well as to offer various perspectives, ISS ESG provides data for the following two different sovereign emission categories:
- Production Emissions: Emission footprint of a country’s production with its imports according to the latest PCAF guidelines released in December 2022.
- Government Emissions: This approach takes into account that a government bond co-finances both direct emissions from the public sector and investments made by the government.
Production emissions
Governament Emissions
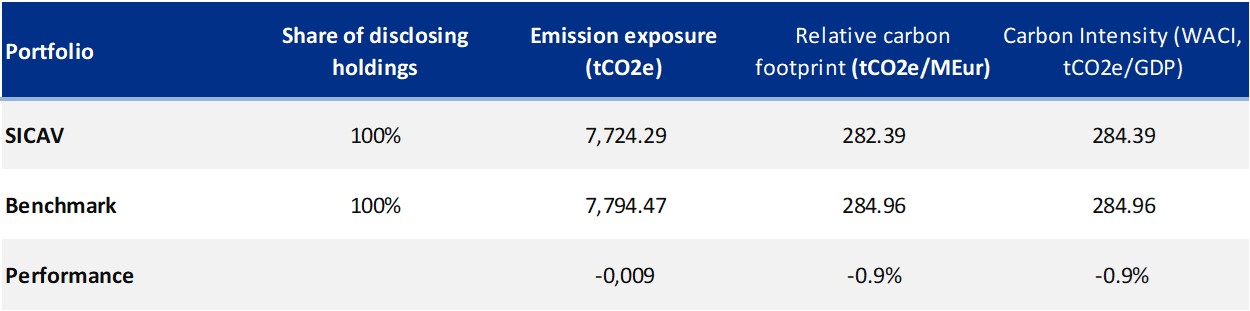
In general, the performance is in line with the benchmark and the gap between the portfolio and the benchmark is smaller than last year. This is due to the new portfolio composition at the end of 2023, which has more or less the same weighting as the benchmark. In 2022, there was indeed a significant overexposure to Italy.
References
[1] https://www.issgovernance.com/esg/
[2] Launched after the 2015 Paris Agreement by the Financial Stability Board (FSB), the Task Force on Climate-related Financial Disclosure (TCFD – https://www.fsb-tcfd.org/) considers climate transparency as a crucial factor for the stability of financial markets. The objective of the TCFD is therefore to improve climate transparency in financial markets through recommendations on disclosure. These recommendations provide a “consistent framework that improves the ease of both producing and using climate-related financial disclosures”. The TCFD aims to create a unique standard for both corporate and investment disclosure, understanding that local regulatory frameworks may require different compliance levels. By October 12, 2023, the TCFD had fulfilled its mission and disbanded, although it remains a valid guideline for assessing and reporting on climate-related risks.
[3] The Sustainable Development Scenario is not more developed in the World Energy Outlook 2022 by the International Energy Agency. However, to guarantee comparability with previous years, this edition of the report still relies on it.
[4] Details on the scenarios and on underlying assumptions are available at World Energy Model – Analysis – IEA
[5] EDP-Energias de Portugal SA holds a 15.5% ownership interest through subsidiary HC Energia in the Trillo nuclear power plant in Spain. Its interest equals 155.5 MW of capacity in the nuclear power plant.
Since HC Energia is not consolidated in its financial statements, the Company does not include nuclear power in its generation fuel mix. Source: Moody’s ESG